
KSO Dashboard Mobile App of PT Sinergi Gula Nusantara
PT Sinergi Gula Nusantara (SGN) is Indonesia's Sugar Sub Holding under PTPN III, managing multiple sugar mills nationwide to support national sugar self sufficiency and modernize the state owned sugar supply chain.
Client:
PT Sinergi Gula Nusantara
Year:
2024
Type:
Mobile App
Role:
UI/UX Designer
Problem Statment
The current KSO Dashboard presents data in an unclear and repetitive way, making it hard for users to quickly interpret and manage operational information.
Goal
Redesign the dashboard to deliver a cleaner, more modern interface with intuitive navigation and more accessible data management.
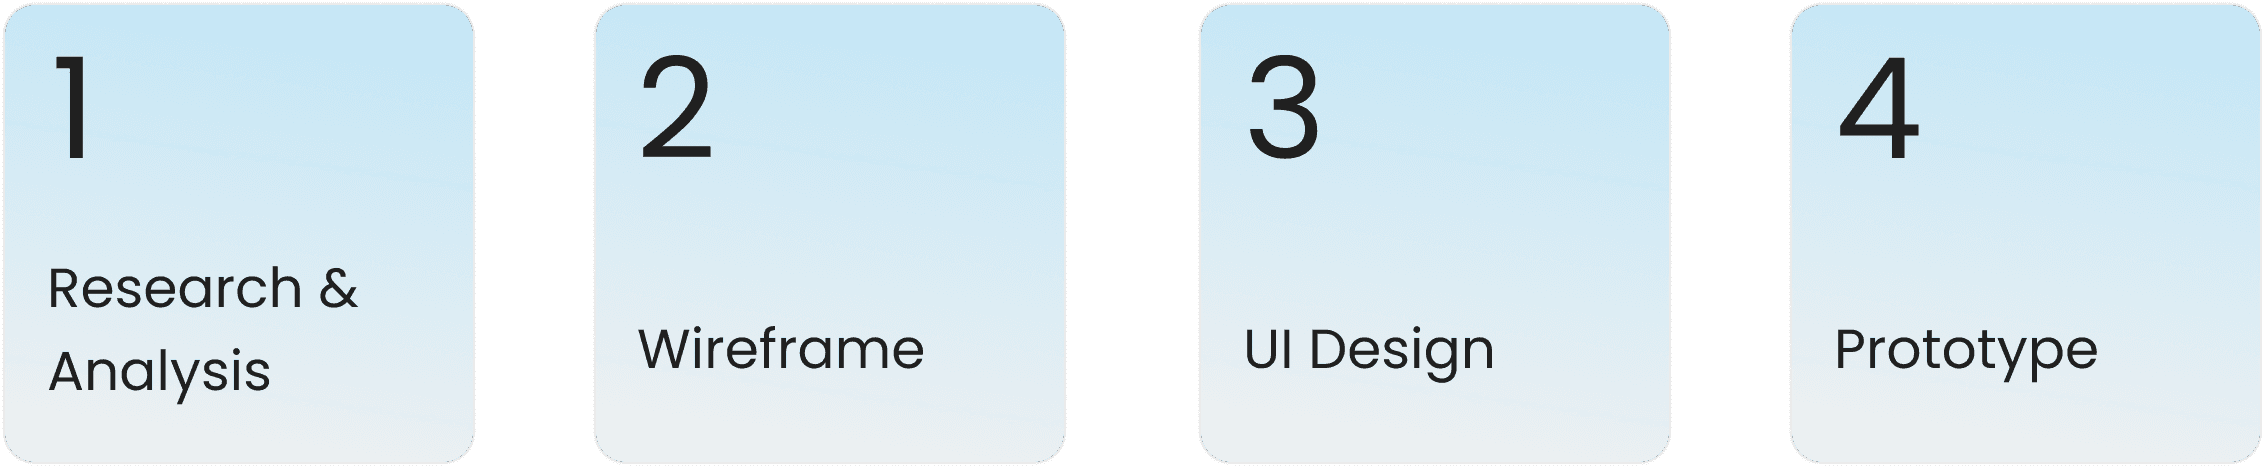
The Design Process
I analyzed the existing dashboard's pain points and defined solutions, built wireframes for cleaner layouts, designed a modern UI, and validated the experience through a prototype.
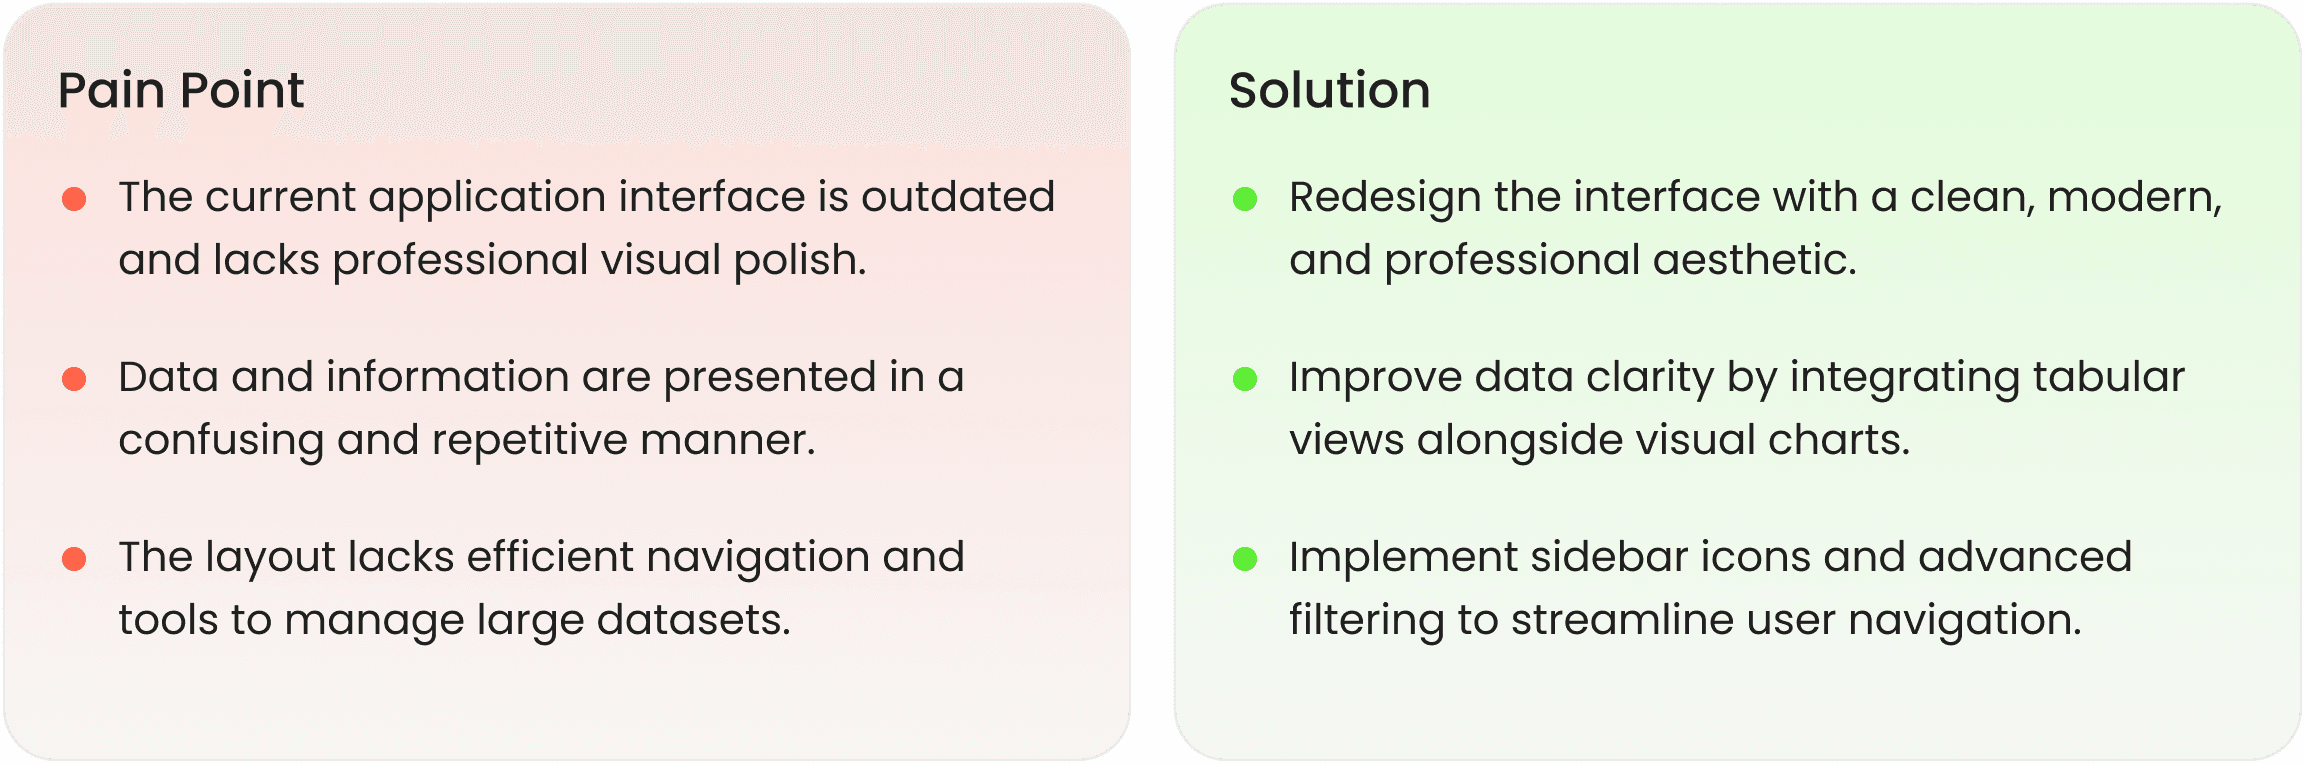
Pain Point & Solution
I identified core pain points around outdated visuals, unclear data, and poor navigation, then translated each into direct design solutions for a more efficient dashboard experience.
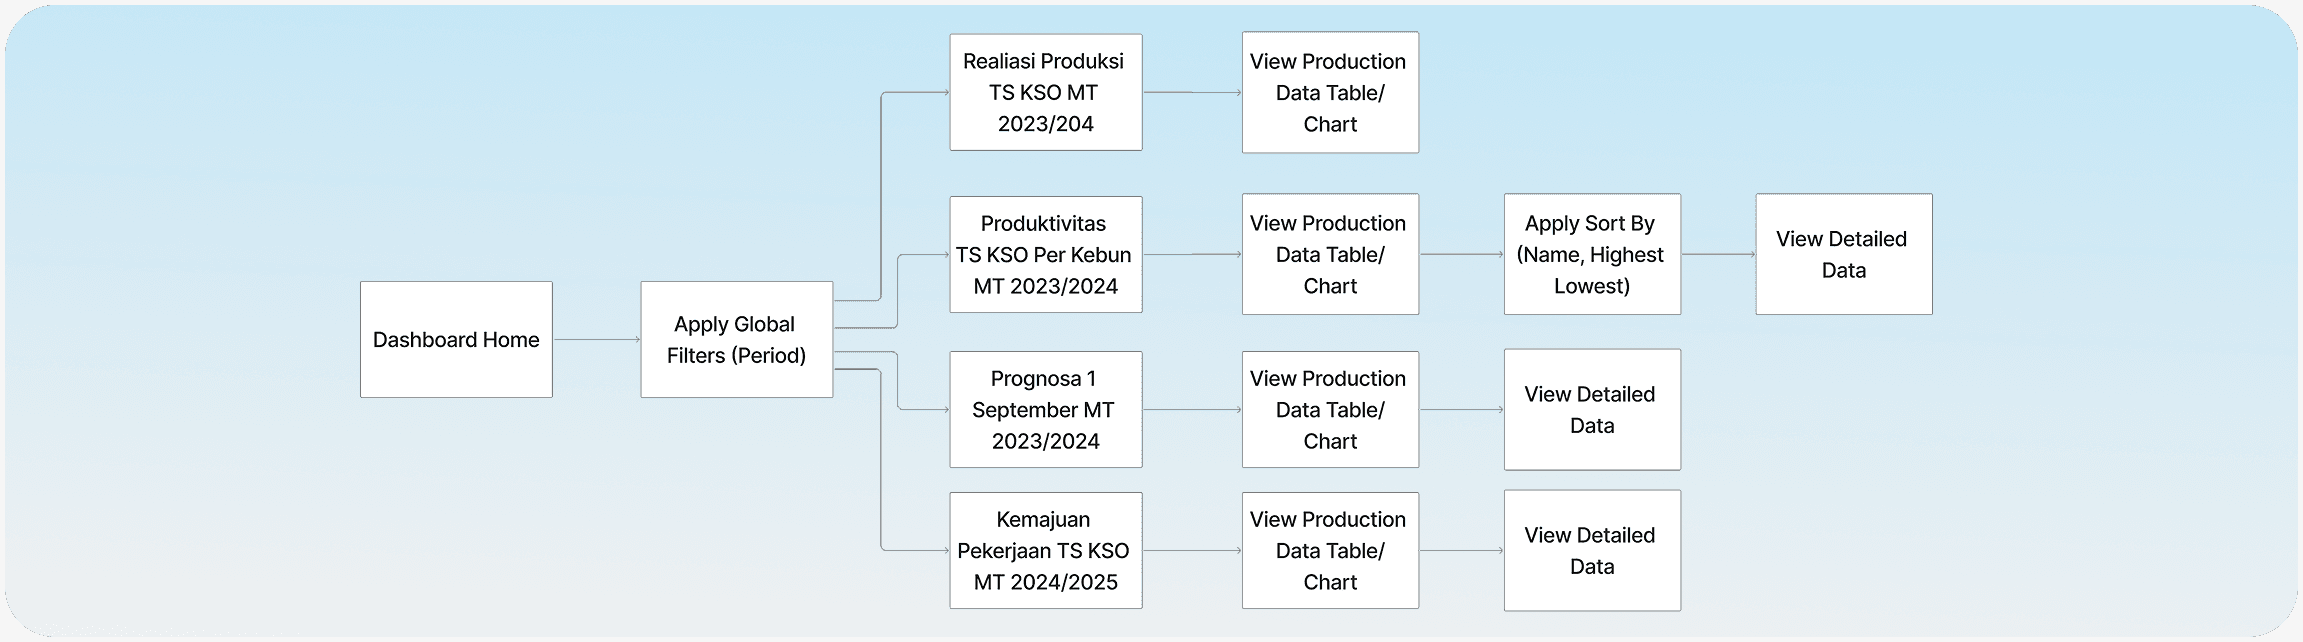
User Flow
I mapped the user flow to ensure users can efficiently navigate from the dashboard, apply filters, and access production data across all categories with minimal steps.
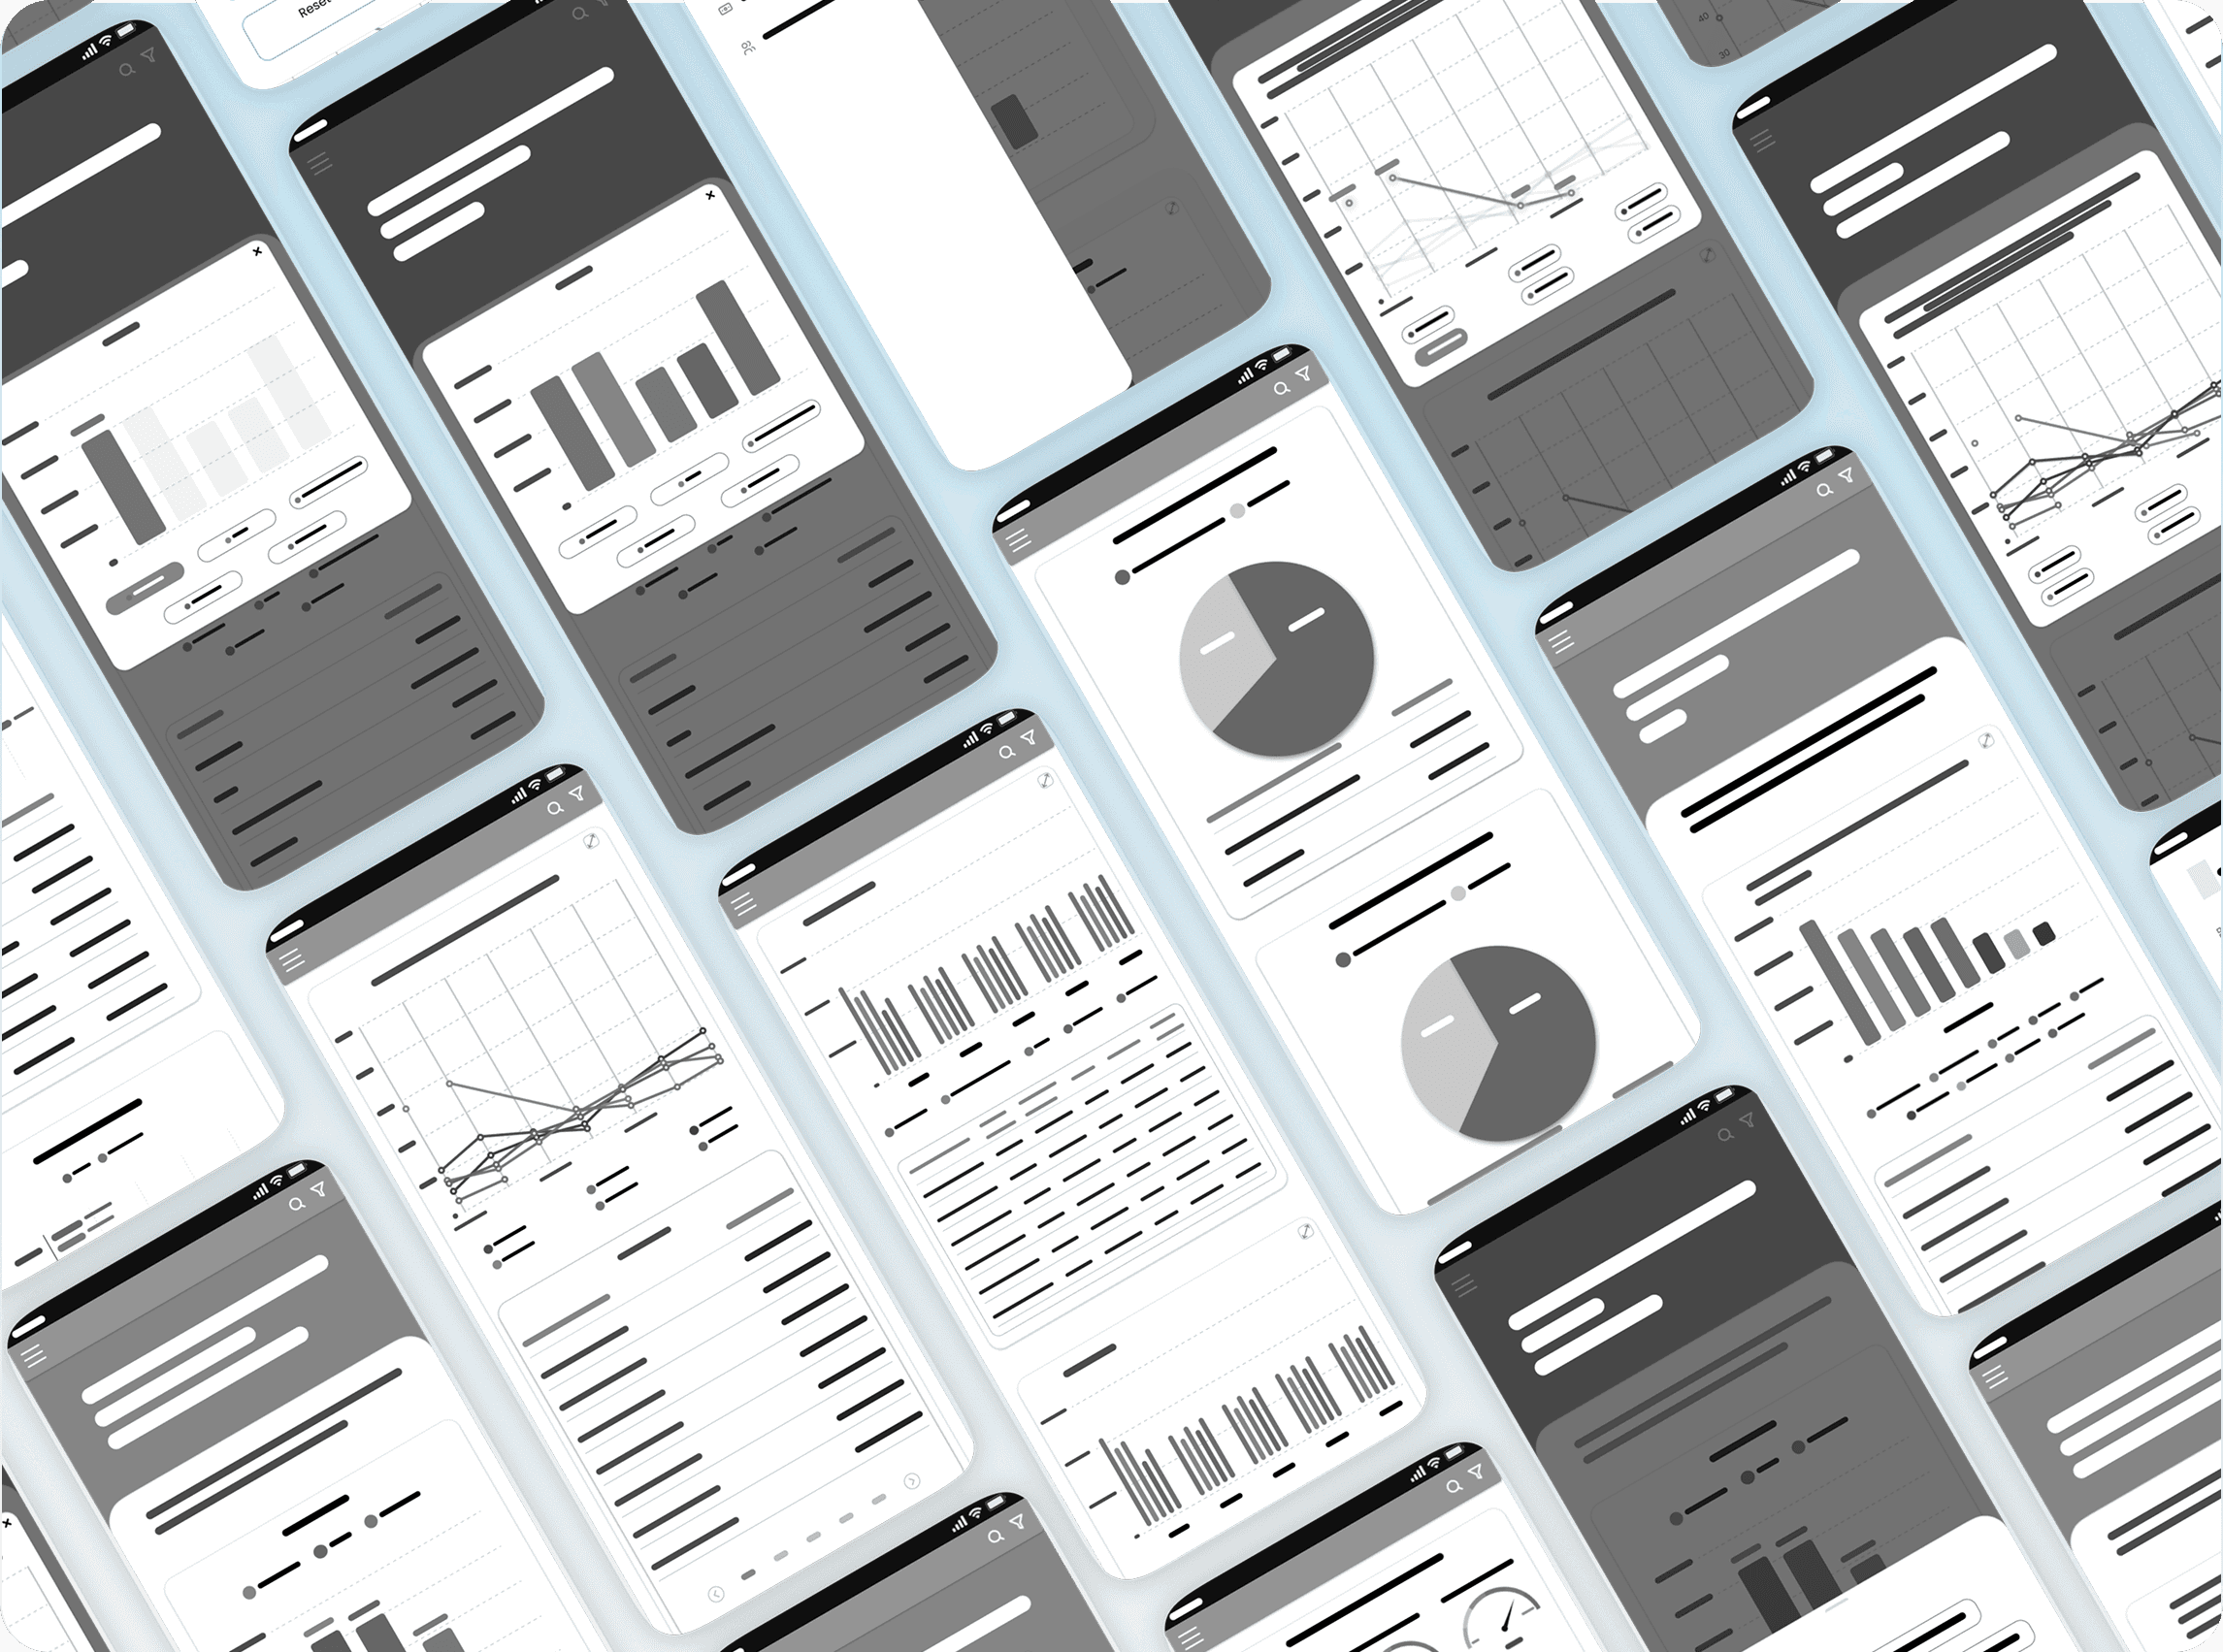
Wireframe
I built wireframes to restructure the dashboard layout, ensuring data and charts are presented clearly and navigation feels intuitive before moving into visual design.
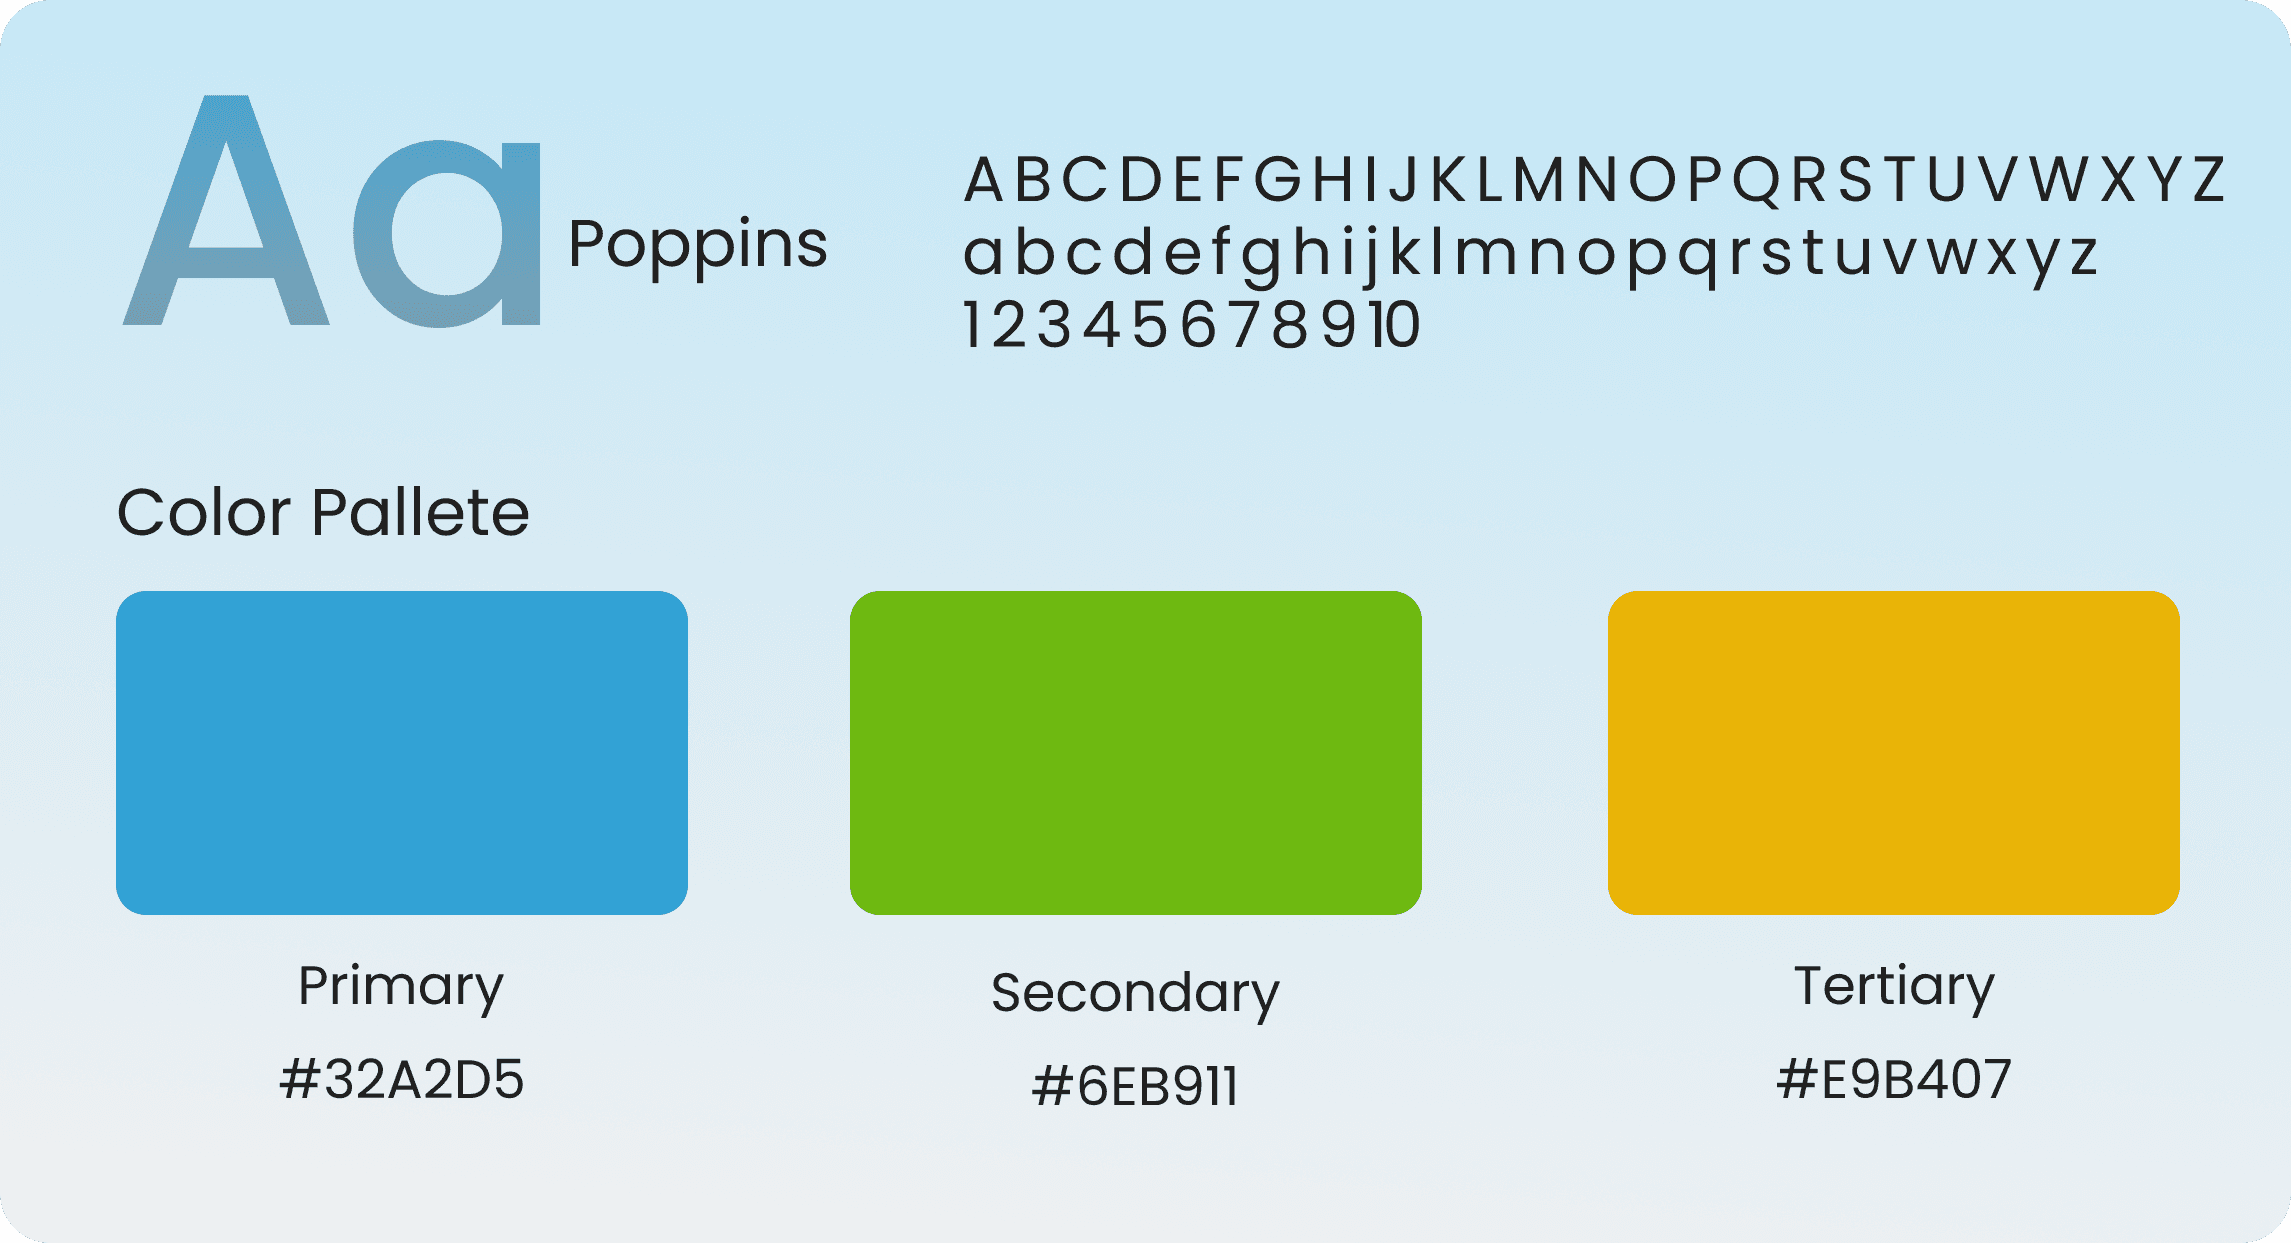
Design System
I built a design system using Poppins for readability, blue for trust, green for SGN's agricultural identity, and yellow to highlight key data points.
Color & Typography
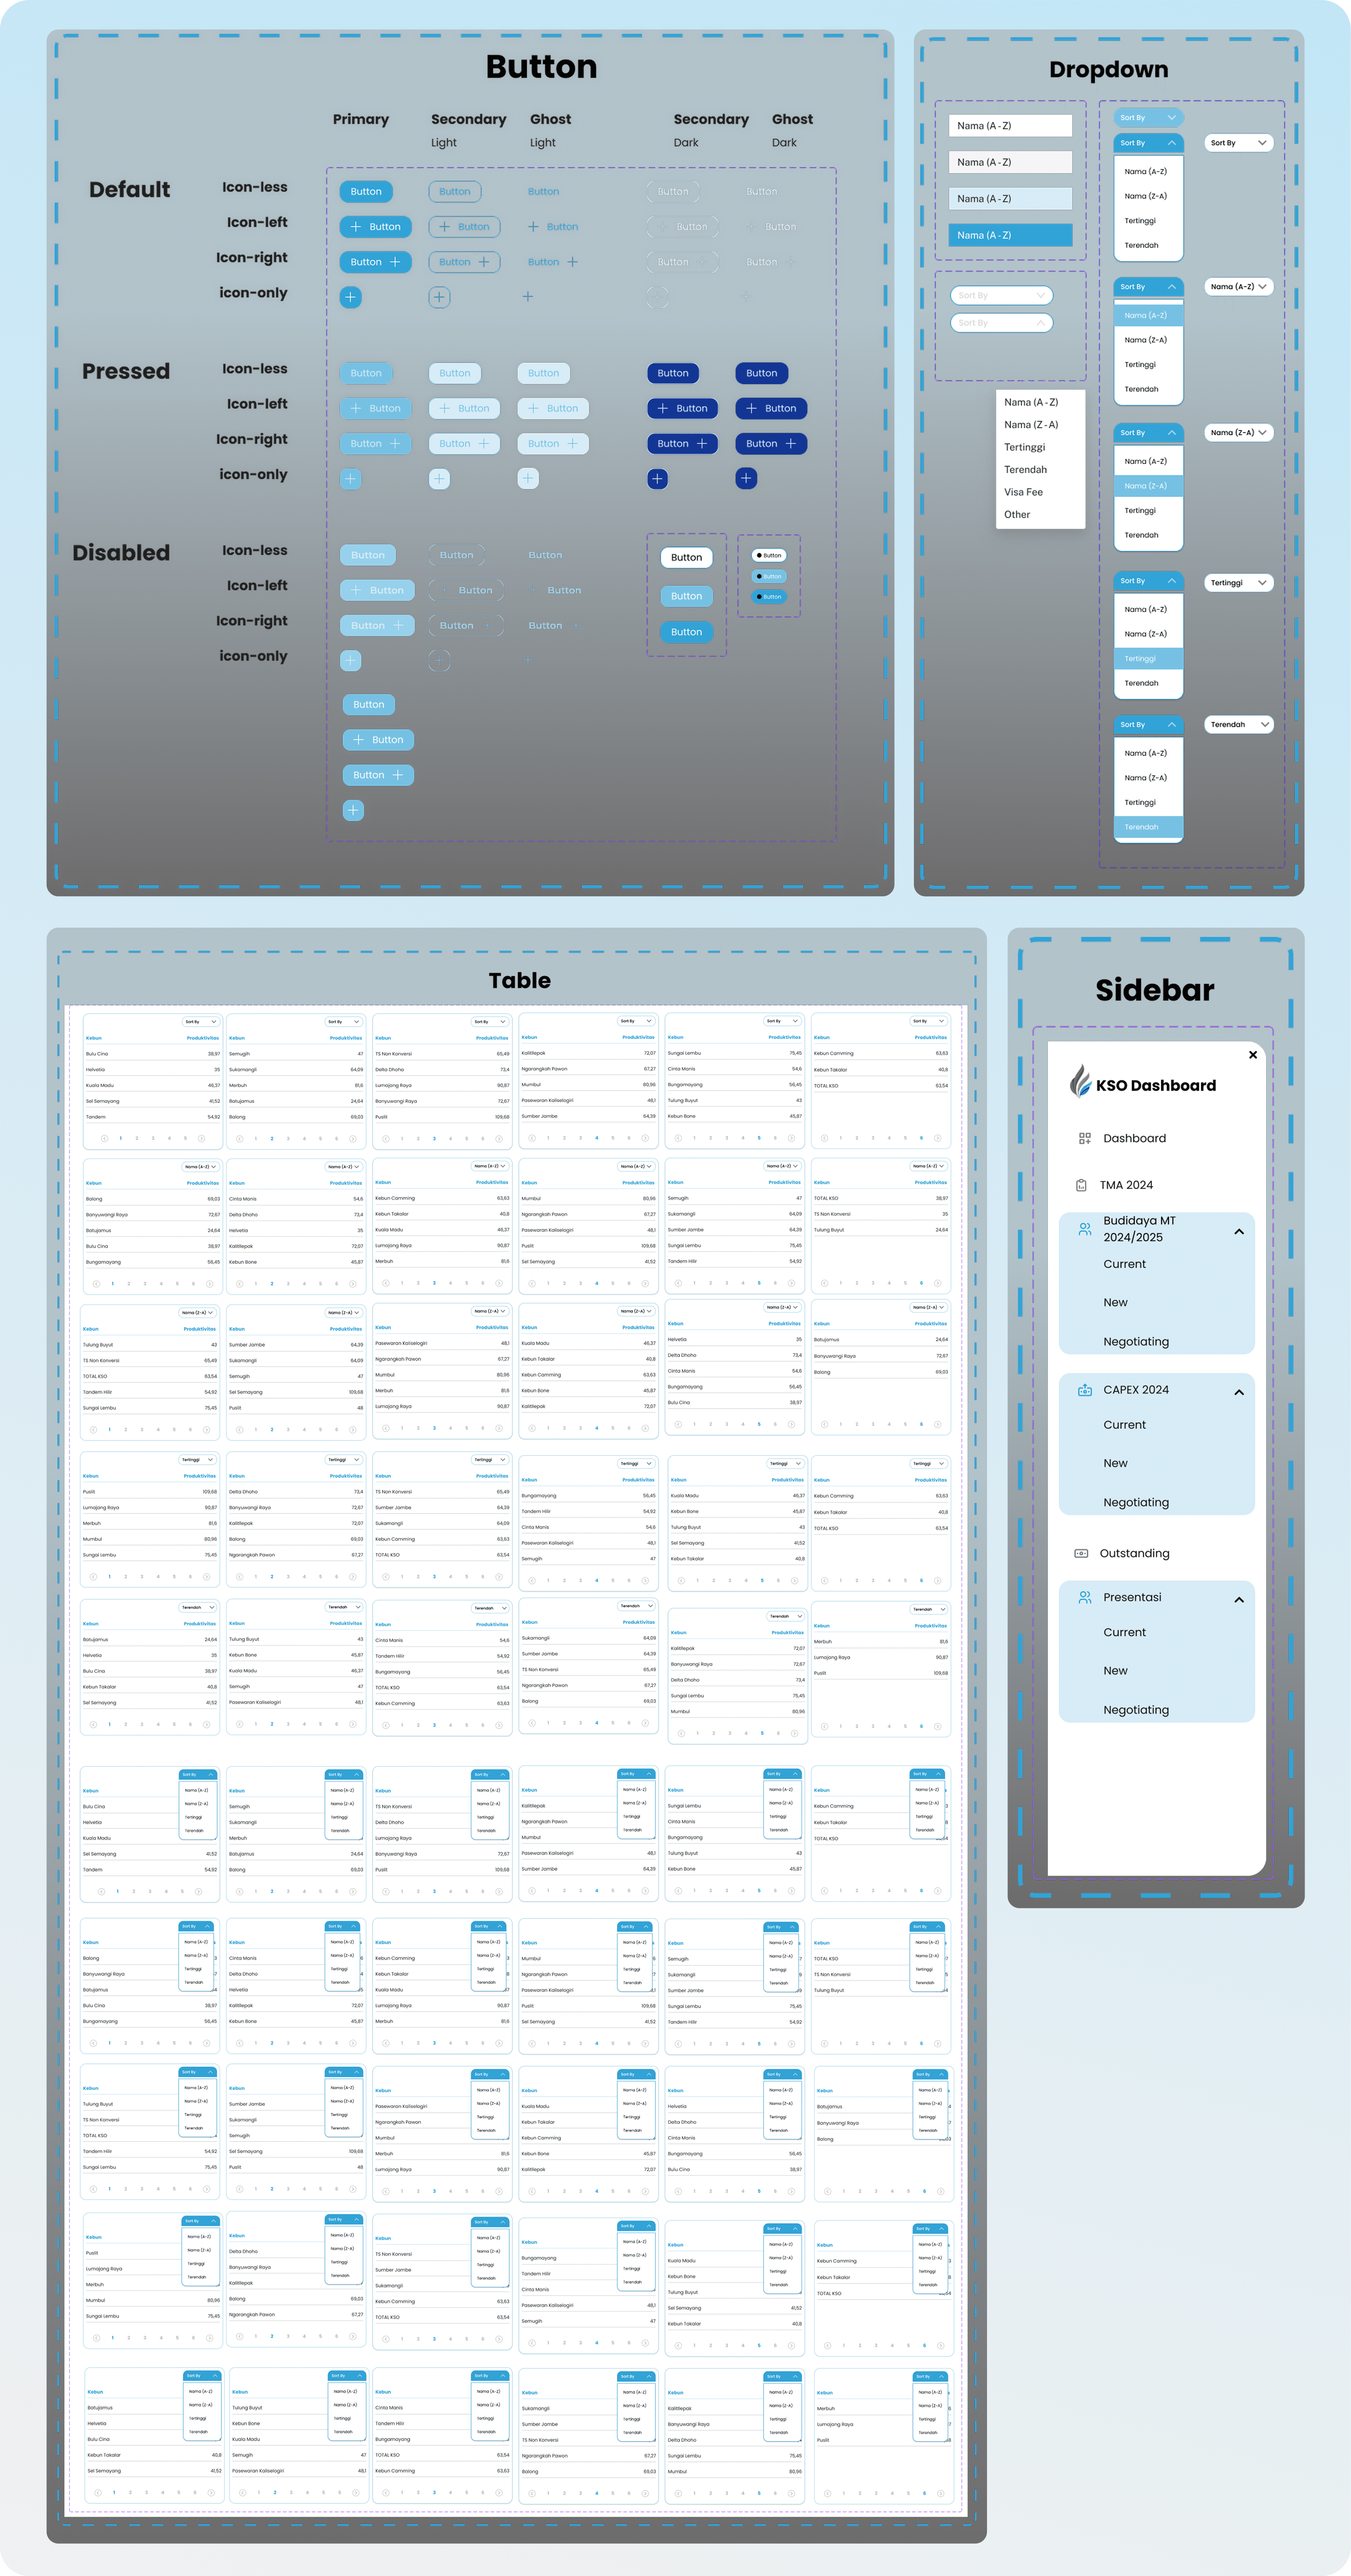
Component
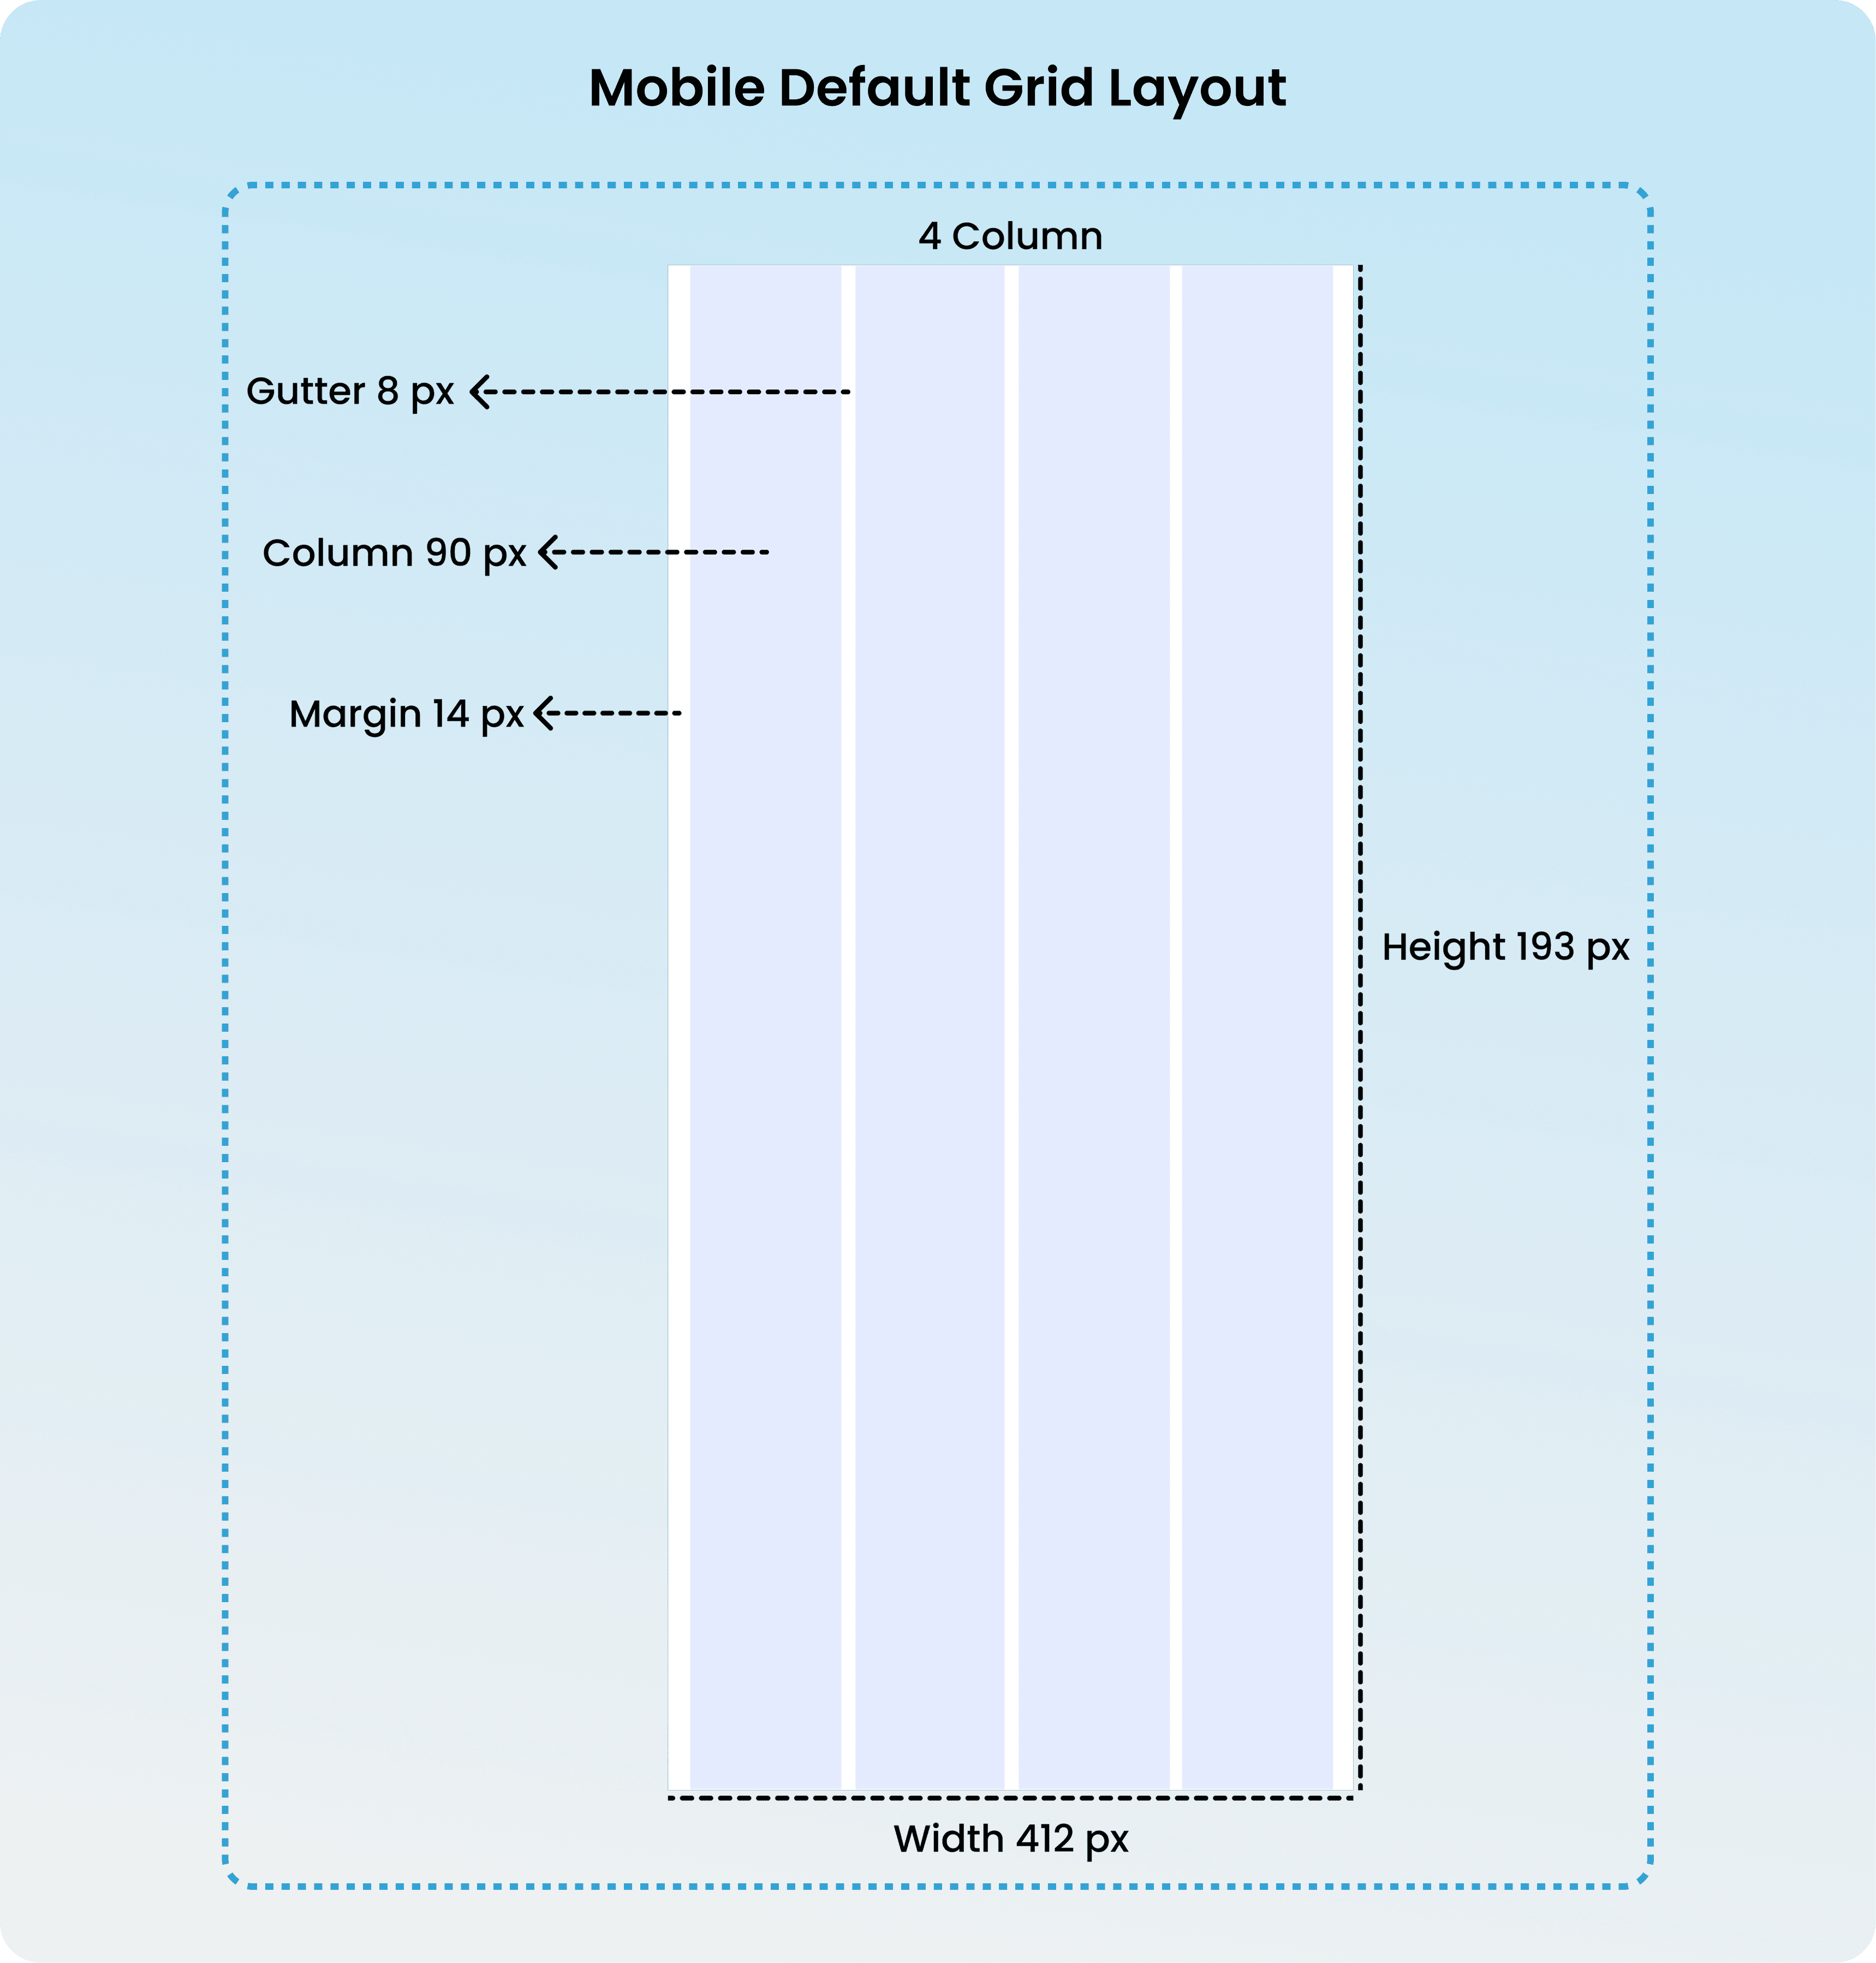
Grid Layout
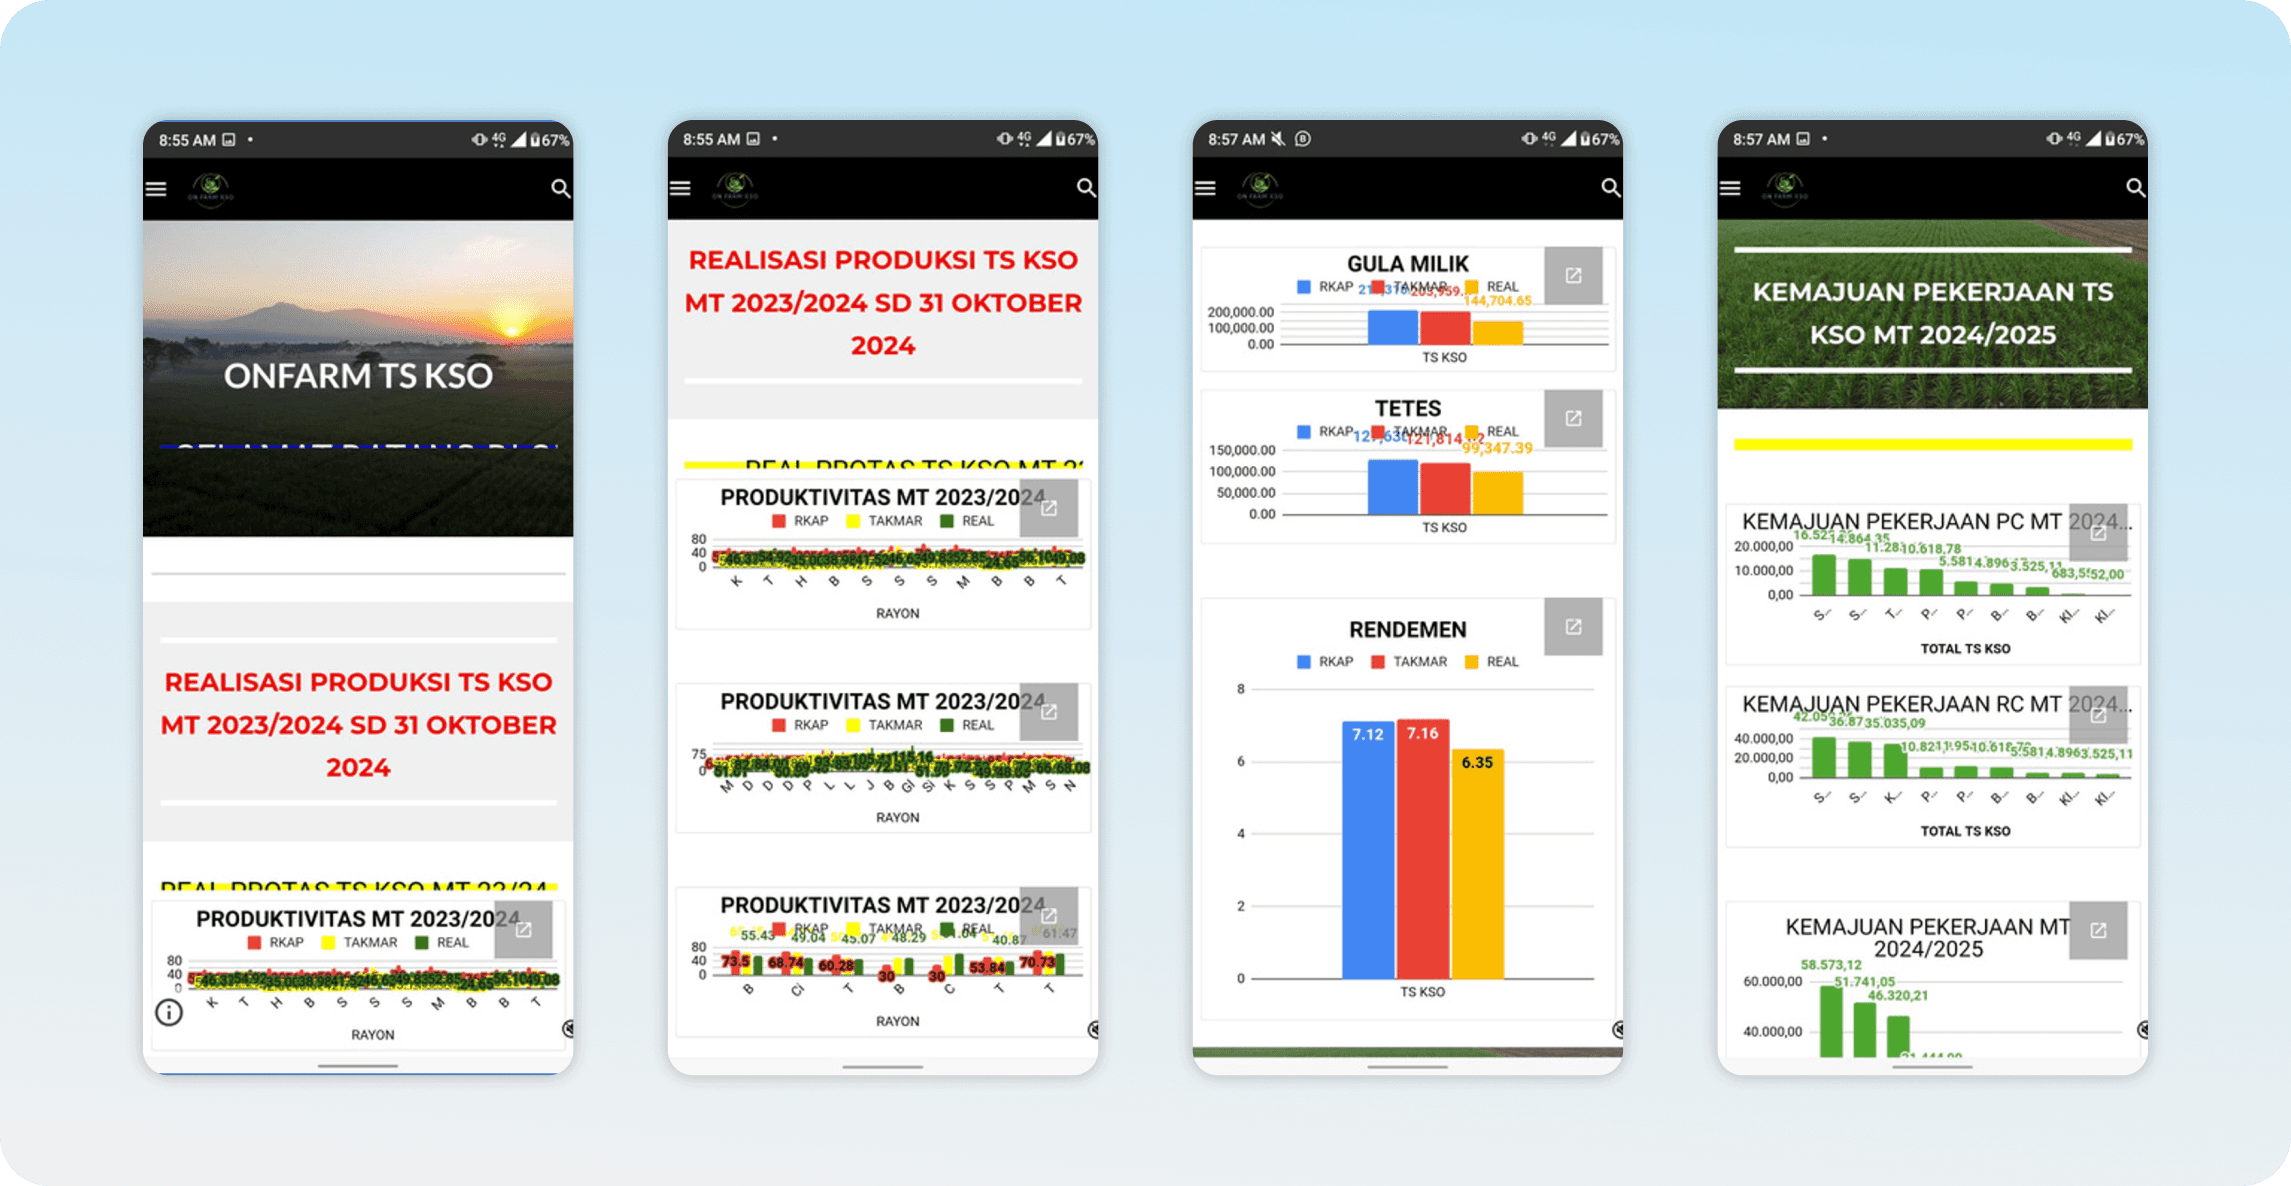
UI Design Before
The original dashboard had outdated visuals, repetitive data presentation, and poor navigation that hindered efficient operational data management.
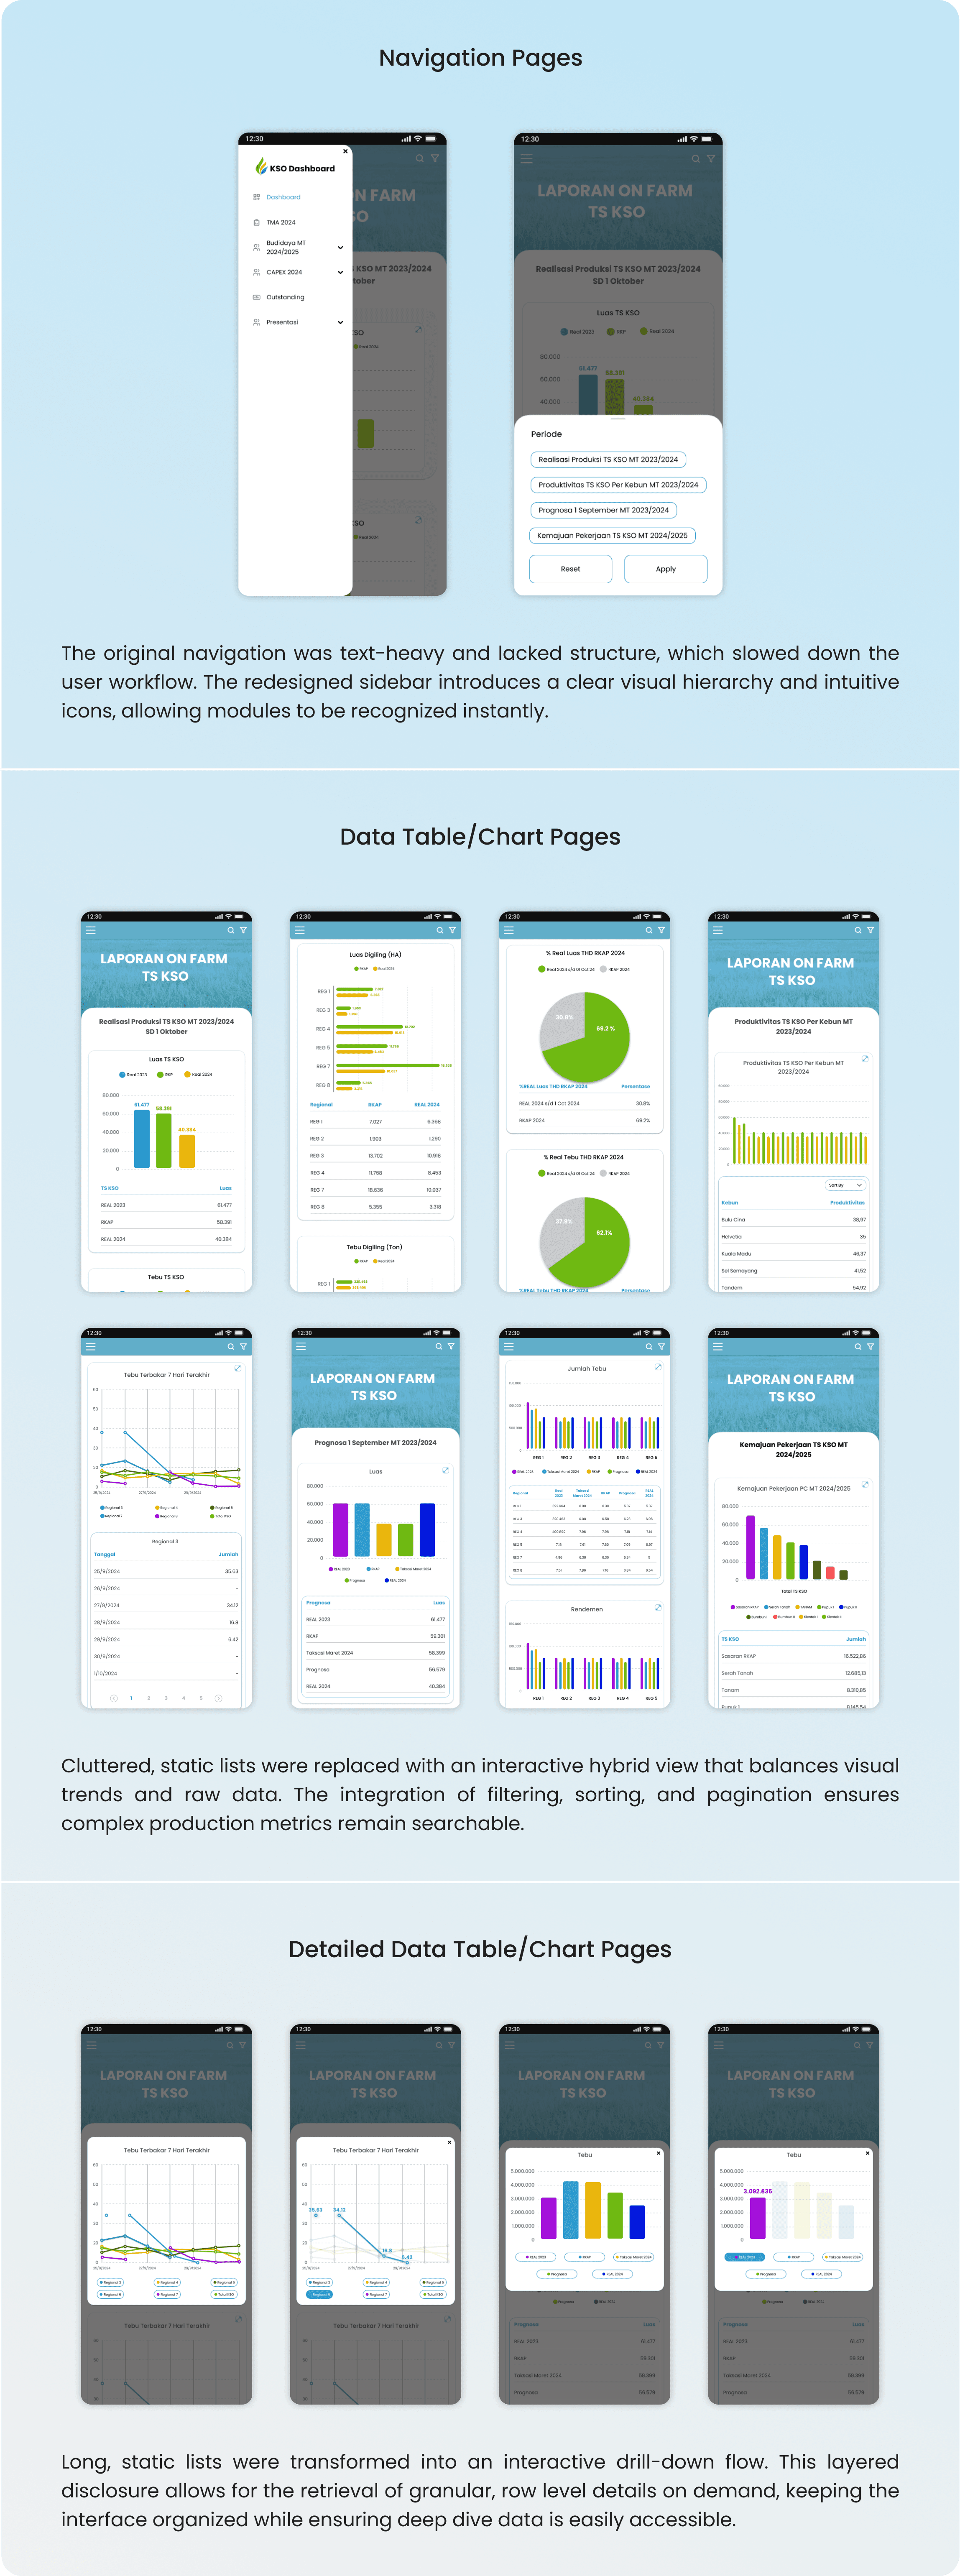
UI Design After
I redesigned the dashboard with intuitive sidebar navigation, interactive data views, and a drill-down flow to deliver a cleaner and more efficient operational experience.
Conclusion
The KSO Dashboard already existed and was being used daily to monitor SGN's operations, but it was genuinely hard to read. Data was repeated across screens, there was no clear hierarchy, and navigating to specific production information took more steps than it should. This wasn't about making it look better, it was about making it actually work for the people relying on it every day to make operational decisions.
What I Learned
Redesigning something people already use is tricky. You can't just throw away how it works because people are already used to it. Every change has to feel like it makes sense, not like it's different for the sake of being different.
Too much information at once helps nobody. When everything is shown on one screen with no clear order, users end up ignoring most of it. Knowing what to show, when, and how much made the biggest difference here.
Sometimes the fix is just removing things. A lot of the problems came from the dashboard trying to do too much at once. Simplifying the flow and cutting the repetitive parts was more impactful than adding anything new.
KSO Dashboard Mobile App of PT Sinergi Gula Nusantara
PT Sinergi Gula Nusantara (SGN) is Indonesia's Sugar Sub Holding under PTPN III, managing multiple sugar mills nationwide to support national sugar self sufficiency and modernize the state owned sugar supply chain.
Client:
PT Sinergi Gula Nusantara
Year:
2024
Type:
Mobile App
Role:
UI/UX Designer
Problem Statment
The current KSO Dashboard presents data in an unclear and repetitive way, making it hard for users to quickly interpret and manage operational information.
Goal
Redesign the dashboard to deliver a cleaner, more modern interface with intuitive navigation and more accessible data management.
The Design Process
I analyzed the existing dashboard's pain points and defined solutions, built wireframes for cleaner layouts, designed a modern UI, and validated the experience through a prototype.
Pain Point & Solution
I identified core pain points around outdated visuals, unclear data, and poor navigation, then translated each into direct design solutions for a more efficient dashboard experience.
User Flow
I mapped the user flow to ensure users can efficiently navigate from the dashboard, apply filters, and access production data across all categories with minimal steps.
Wireframe
I built wireframes to restructure the dashboard layout, ensuring data and charts are presented clearly and navigation feels intuitive before moving into visual design.
Design System
I built a design system using Poppins for readability, blue for trust, green for SGN's agricultural identity, and yellow to highlight key data points.
Color & Typography
Component
Grid Layout
UI Design Before
The original dashboard had outdated visuals, repetitive data presentation, and poor navigation that hindered efficient operational data management.
UI Design After
I redesigned the dashboard with intuitive sidebar navigation, interactive data views, and a drill-down flow to deliver a cleaner and more efficient operational experience.
Conclusion
The KSO Dashboard already existed and was being used daily to monitor SGN's operations, but it was genuinely hard to read. Data was repeated across screens, there was no clear hierarchy, and navigating to specific production information took more steps than it should. This wasn't about making it look better, it was about making it actually work for the people relying on it every day to make operational decisions.
What I Learned
Redesigning something people already use is tricky. You can't just throw away how it works because people are already used to it. Every change has to feel like it makes sense, not like it's different for the sake of being different.
Too much information at once helps nobody. When everything is shown on one screen with no clear order, users end up ignoring most of it. Knowing what to show, when, and how much made the biggest difference here.
Sometimes the fix is just removing things. A lot of the problems came from the dashboard trying to do too much at once. Simplifying the flow and cutting the repetitive parts was more impactful than adding anything new.